


The Accountability Gap: Asset Managers and Excessive Executive Compensation
What Say-on-Pay Votes Reveal About Stewardship in Practice
By Mikhael Gaster, Executive Director for the Center for Active Stewardship; Gina Falada, Associate Director, Advancing Worker Justice for ICCR; and Rosanna Landis Weaver.
On May 21st 2026, an overwhelming 81% of Welltower’s shareholders voted against Chief Executive Officer Shankh Mitra’s $821 million long-term compensation package, the second-largest CEO pay award in the U.S. after Elon Musk’s, according to the Wall Street Journal. Proxy adviser Institutional Shareholder Services urged investors to reject the award, calling it an “extraordinary” package; Land & Buildings Investment Management dubbed it “the most aggressive executive compensation structure in public REIT history”.
Despite the warnings, not all institutional investors voted with the overwhelming majority of Welltower shareholders. Both Vanguard and Goldman Sachs supported the Say-on-Pay (SoP) proposal – a non-binding shareholder vote to approve the CEO pay – which was opposed by BlackRock, State Street, Fidelity, Legal and General, and over 80% of Welltower shareholders. Could this have been an oversight by Vanguard and Goldman, an isolated instance?
ICCR partnered with the Center for Active Stewardship (CAS) to examine asset manager voting on 27 failed Say-on-Pay (SoP) proposals from the 2026 proxy season. Powered by CAS, our research revealed that Vanguard supported 17 out of the 25 failed CEO pay packages it held/voted on (voting in misalignment with the majority of votes cast 68% of the time). Goldman Sachs also supported 19 out of 24 CEO pay packages that the majority of shareholders opposed last year (79% misalignment). The Welltower vote was not an anomaly.
In comparison, Legal and General opposed all 22 of these failed SoP proposals they voted on, demonstrating 100% alignment with the majority of votes cast, as did UBS, Amundi, BNP Paribas, and HSBC.
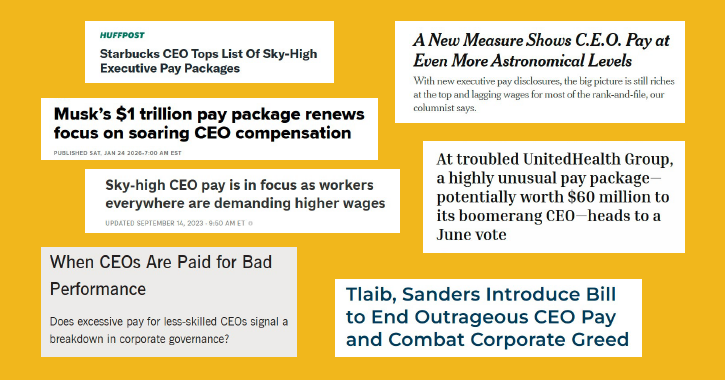
While competitive compensation is an important criterion for attracting, incentivizing and retaining skilled executive managers, investment fiduciaries have witnessed CEO pay rise over 1000% in the last fifty years. In the United States, CEO-to-worker pay ratios at large companies are nearly 300:1. In Canada, the gap is also significant, with CEOs at large companies earning roughly 250 times more than the typical worker. Yet, investor opposition to advisory Say on Pay proposals is falling, so who are the managers supporting CEO pay even at companies where the majority of votes were cast against it?
In 2022, the SEC passed Rule 14Ad-1 requiring institutional investment managers to report annually on Form N-PX how they voted on executive compensation. Despite mandatory disclosure rules, it has been onerous to identify asset managers voting in misalignment with the majority of votes cast, in a timely and effective manner, but a new tool is changing all that.
A New Accountability Tool
The Center for Active Stewardship’s newly released Scorecards platform allows asset owners and other stakeholders to easily parse the voting records of hundreds of firms and thousands of funds to determine how their managers voted on issues that matter to them, including compensation. This free, public-facing tool allows users to easily research and compare their managers’ and funds’ voting records on all management and shareholder proposals going back to July 2023.
| Category | Description | Examples |
| Full Reporting | Registered management investment companies, regardless of size. | ETFs (except unit investment trusts), mutual funds, closed-end funds. |
| Say-on-Pay Only | Other institutional managers required to file Form 13F (generally $100M+ in qualifying securities). | Hedge funds, banks, insurers, pension funds, endowments, family offices, wealth managers, broker-dealers, non-U.S. managers. |
| No N-PX Requirement | Entities not covered by either reporting requirement. | Unit investment trusts (UITs), including SPY, DIA, MDY; smaller institutional managers; individuals. |
Methodology
The CAS Scorecards follow a simple methodology. The user identifies the proposals they want to investigate from a directory of all management and shareholder proposals in the database, and chooses a Desired Vote (For or Against) they would like each institution/fund to have voted on the proposal. The scorecard grades each institution/fund by how closely their actual votes aligned with the scorecard’s Desired Vote.
The Scorecards platform calculates alignment for an institution/fund by first assessing whether, for each proposal, they voted more shares in the “aligned” or “misaligned” direction (as defined for each proposal by the scorecard). In a second step, an overall “Alignment Score” is then produced by computing the percentage of proposals that were net aligned, as a share of all proposals in this scorecard that the institution/fund voted on. Users can choose whether their scorecard counts abstentions as either “misaligned” or “excluded” – in this SoP scorecard, ICCR and CAS are excluding abstentions, as abstaining on a SoP proposal is not a clear signal in either direction.
ICCR partnered with CAS to create a scorecard that examines asset manager voting on 27 failed SoP proposals from July 1, 2025 to June 30, 2026, to see how aligned the institutions/funds were in their understanding of risk with the majority of shareholders at these companies – who had overwhelmingly voted against these SoPs. The proposals integrated into the scorecard included:
| Company | Shareholder Support/ Vote | |
| 1 | Aon plc | 38.70% |
| 2 | Arrowhead Pharma | 40.00% |
| 3 | Ashford Hospitality Trust Inc. | 20.00% |
| 4 | Beyond Meat Inc. | 31.70% |
| 5 | Chemed Corp. | 38.70% |
| 6 | Coffee Holding Co Inc. | 38.00% |
| 7 | Element Solutions Inc. | 41.10% |
| 8 | HF Foods Group Inc. | 49.30% |
| 9 | Hilltop Holdings | 42.00% |
| 10 | Iterum Therapeutics plc | 39.00% |
| 11 | JAKKS Pacific Inc. | 46.30% |
| 12 | Luminar Technologies, Inc. | 6.40% |
| 13 | MarketWise, Inc. | 44.90% |
| 14 | Microchip Technology Inc. | 45.60% |
| 15 | Nabors Industries Ltd. | 33.70% |
| 16 | Netcapital Inc. | 38.60% |
| 17 | nLIGHT, Inc. | 38.50% |
| 18 | Palo Alto Networks Inc. | 46.10% |
| 19 | Red Cat Holdings, Inc. | 40.80% |
| 20 | Rithm Property Trust Inc. | 30.60% |
| 21 | Skyworks Solutions | 49.80% |
| 22 | Snowflake Inc. | 43.50% |
| 23 | TG Therapeutics, Inc. | 39.20% |
| 24 | Thermo Fisher Scientific Inc. | 31.70% |
| 25 | Warner Bros Discovery Inc. | 15.60% |
| 26 | Welltower Inc. | 18.90% |
| 27 | Zomedica Corp. | 43.60% |
Findings from ICCR’s Say on Pay Scorecard
The scorecard reveals that a number of European managers are consistently voting against CEO pay packages in alignment with the majority of votes cast:
- Legal and General (voted against SoP in 22/22 possible votes)
- UBS (voted against 21/21 possible SoP votes)
- Amundi (voted against 16/16 known SoP votes)
- BNP Paribas (voted against 15/15 possible SoP votes)
- HSBC (voted against 13/13 possible SoP votes)
A number of public pension funds also opposed all failed SoPs including:
- State Board of Administration of Florida System (voted against SoP in 19/19 known votes)
- Teachers Retirement System of Texas (voted against SoP in 16/16 possible votes)
- State of Wisconsin Investment Board (voted against SoP in 16/16 known votes)
- Maryland State Retirement & Pension System (voted against SoP in 15/15 possible votes)
- NY State Teachers’ Retirement System (voted against SoP in 12/12 possible votes)
In contrast, a number of U.S. asset managers (including the Big 3) voted very differently:
- With 5 votes unknown, Citadel voted against none of the SoPs in the scorecard – indicating 0% alignment with the majority of shareholders
- Goldman Sachs voted against 5/24 possible SoPs (21% alignment)
- Vanguard voted against 8/25 possible SoPs (32% alignment)
- State Street voted against 12/24 possible SoPs (50% alignment)
- BlackRock voted against 16/23 possible SoPs (70% alignment)
The scorecard allows you to compare managers’ voting alignment:
Curious how your manager, fund, or trustees voted? Visit the scorecard here.
A Stewardship Gap?
A recent article in the Harvard Law School Forum on Corporate Governance found that in 2026, average S&P 500 SoP support reached 90.3%—the only time it has been above 90% in the past 5 years. The authors found that the “big five” investors deviated from proxy advisor SoP opposition in an overwhelming majority of cases choosing instead to rely heavily on their proprietary voting frameworks. If funds support CEO pay when the majority of votes are cast against it could suggest guidelines are too lenient. Last year ICCR did an extensive review of member guidelines which tend to be appropriately more rigorous than those of funds without a moral perspective.
As average support for CEO pay continues to rise at a time of rising CEO pay, tools like this SoP scorecard will make it easier for asset owners to examine how their managers are voting on excessive executive compensation.